


Instagram has added a new feature called Competitive Insights to its Professional Dashboard. The tool is designed for brands and creator accounts, allowing them to compare their activity and engagement with other profiles on the platform.
The feature was first spotted by digital marketing advisor Sarah Roizman, who shared screenshots of the update in a Threads post.

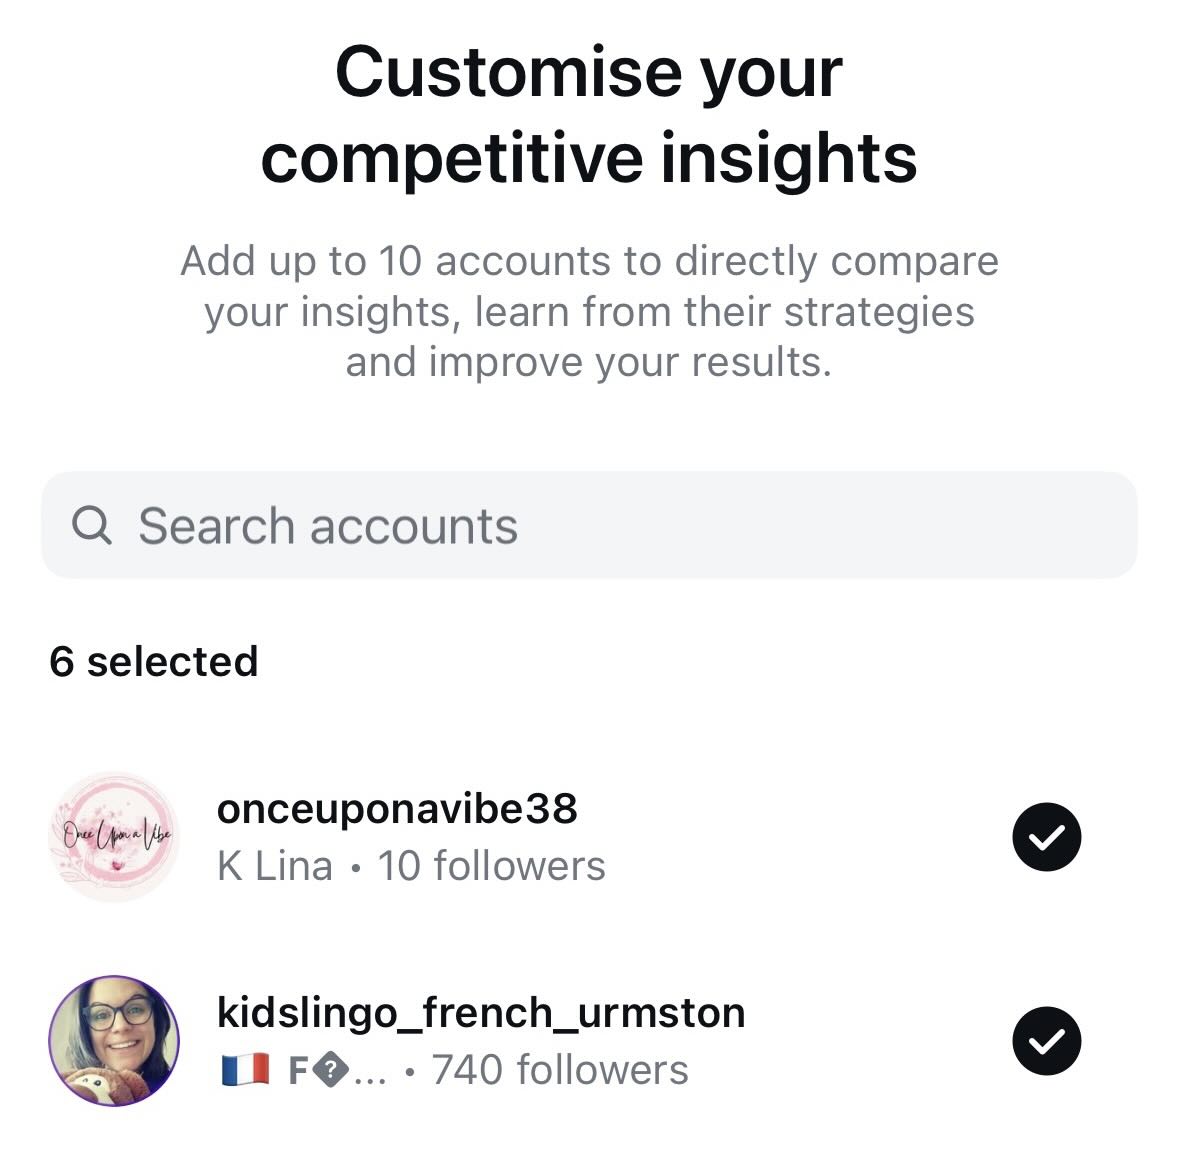
How the feature works
Users can add up to ten accounts they consider direct competitors to benchmark against and then select a time range, such as 60 days. Once selected, the dashboard displays side-by-side metrics such as follower growth and posting frequency. Comparisons cover different types of content, including Reels, feed posts, and ads.
For example, a brand might want to understand why a competitor’s Reels attract more attention during weekends. By selecting that competitor inside Competitive Insights, the brand can see how often the competitor posts Reels during that period and whether their follower count increased faster. This gives context for planning future posting schedules without relying on assumptions.
The tool also allows users to view engagement data for individual posts from competitor accounts, even when those accounts have hidden their like counts. This provides a snapshot of how posts perform compared with similar accounts.
A marketer can check how a carousel post performed relative to a Reel from the same competitor and connect it to factors such as timing or the type of call-to-action used. While the feature does not display private analytics such as saves or shares, it still shows visible engagement patterns that help users understand what is working across their accounts.
The feature also tracks follower growth, allowing users to see how their audience expands relative to selected accounts. It also breaks down posting frequency by content type, including Reels, feed posts, and ad campaigns.
Limitations of the new tool
Social Media Today notes that Competitive Insights provides only basic metrics. Users cannot access cumulative performance analytics or graphs that compare all metrics across multiple accounts at once. Comparisons are one-on-one and do not include grouped data.
Users will also not see conversion-related data such as clicks, saves, shares, or engagement rate. This means the feature is useful for spotting trends, such as whether a competitor is posting more frequently or growing followers faster, but it does not replace detailed analytics tools.
What this means for brands and advertisers
Brands and creators can use the data to inform posting schedules or content strategies, even with its limitations. They can use the tool to compare how often competitors post and how audiences respond. Previously, businesses relied on third-party analytics tools for similar insights. Now, Instagram is bringing basic comparisons directly into the platform. If a rival increases their use of Reels during a campaign window, the dashboard will show that pattern and help users decide whether their own schedule should adjust.
This could also allow smaller marketing teams to review content themes. If engagement spikes on a competitor’s posts, brands can check whether those spikes align with specific topics or posting times. The tool does not explain why the spike happened, but it shows that it happened, so brands can investigate further with their own insights.