


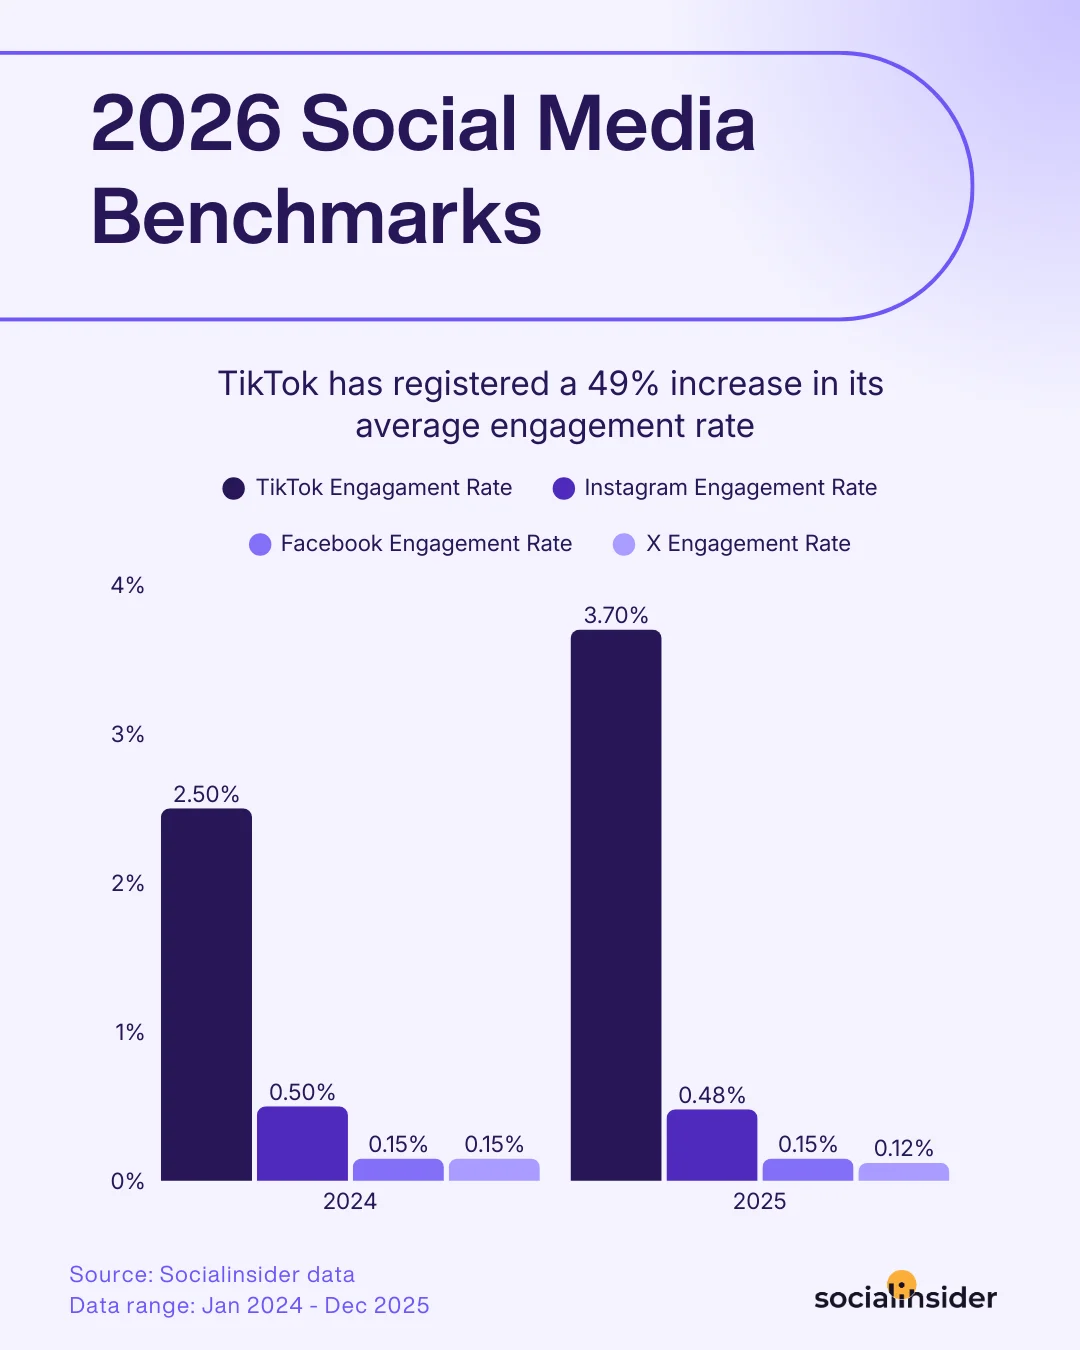
TikTok's engagement rate surged 49% year-over-year to 3.70% in 2025, more than seven times Instagram's 0.48% and nearly 25 times Facebook's 0.15%, according to Socialinsider's 2026 Social Media Benchmark Report. The report is based on 70 million posts from international brand accounts tracked between January 2024 and December 2025. It shows a platform engagement landscape that continues to diverge sharply in TikTok's favor.
How the platforms compare
The engagement gap between TikTok and every other major platform is widening, not narrowing. Instagram's rate dipped slightly from 0.50% to 0.48%; Facebook held flat at 0.15%; X fell from 0.15% to 0.12%. TikTok moved in the opposite direction.
Per-post metrics show the same pattern. TikTok averaged 3,492 likes per post in 2025, up 12%, against Instagram's 335 (down 15%), Facebook's 255 (up 64% from a low base), and X's 15 (down 62%). TikTok brands also averaged 248 shares per post, up 45%, compared to Instagram's 45, Facebook's 17, and X's 1.
View counts tell a slightly different story for two platforms. TikTok averaged 6,496 views per post, up 3%. Instagram averaged 3,403 views, up 29%, indicating content is reaching more users even as fewer engage. Facebook's views fell 17% to 913 per post; X's views rose 50% to 2,979.

Facebook brands pull back on posting
One of the most significant findings in Socialinsider's data is how brands are responding to Facebook's low returns. Average posting frequency fell 48%, from 47 posts per month to 24. That is a deliberate resource reallocation, not a gradual drift. TikTok and Instagram brands both maintained approximately five posts per week, consistent with both platforms' algorithmic preference for consistent cadence.
X: more volume, less return
X presents the inverse situation. Posting frequency increased 40% to 70 posts per month, even as the platform's engagement rate declined to 0.12%. Average likes per post dropped 62% to 15, and average shares per post held flat at 1. For brands still deploying significant content volume on X, Socialinsider's data makes the return on that investment difficult to justify by engagement metrics alone.
What this means for content strategy
Socialinsider's benchmark data reinforces the case that organic TikTok delivers higher engagement per post than any other major platform by a significant margin. For marketers allocating resources across platforms, the data supports concentrating organic video investment on TikTok and Instagram while treating Facebook primarily as a paid and retargeting channel rather than an organic content priority.
The Instagram view count increase (up 29%) alongside a slight engagement rate decline is worth noting. More content is being served, but proportionally fewer users interact. The trend points to an algorithm that is distributing content more broadly while the pool of actively engaging users grows more slowly. For brands benchmarking Instagram performance, reach and views are a more accurate measure of current organic performance than engagement rate alone.
Recap
What is the average TikTok engagement rate in 2025?

According to Socialinsider's 2026 Social Media Benchmark Report, TikTok's average engagement rate reached 3.70% in 2025, up 49% from 2.50% the prior year. The report is based on 70 million posts from international brand accounts tracked across January 2024 through December 2025.
How does TikTok's engagement rate compare to Instagram and Facebook?
TikTok's 3.70% engagement rate is more than 7x Instagram's 0.48% and nearly 25x Facebook's 0.15%, per Socialinsider's 2026 data. The gap continued to widen year-over-year: Instagram's rate dipped from 0.50%, Facebook's held flat, and X's fell from 0.15% to 0.12%.
What does the decline in Facebook posting frequency mean for marketers?
Socialinsider's data shows Facebook brands reduced their average posting cadence from 47 to 24 posts per month, a 48% drop. The shift indicates brands are making an active resource reallocation decision away from Facebook organic content, likely in response to sustained low engagement returns on the platform.
